Slovenia is an export oriented country with a large share of industry and a sustained growth rate in the past with optimistic forecasts for the next years. Slovenia encourages foreign investment to exploy the possibilities for their projects.
Slovenia is one of the few countries with 100% macroeconomic stability (World Economic Forum's Global Competitiveness Index 2019), ensuring low-risk environment to investors. What is more, the World Bank’s Doing Business 2020 indicators rank Slovenia in 37th place among 190 world economies, highlighting Slovenia’s commitment to provide stimulating business conditions. The economy is diversified and well immersed into the European production chain.
Slovenia’s economy has been stable having a sustained growth rate in the past and optimistic forecasts for the years to come, low inflation, a current account surplus, and a fiscal surplus, as well as declining sovereign debt.
| 2020 | 2021 | 2022 | 2023 | 2024 forecast | 2025 forecast | |
|---|---|---|---|---|---|---|
| GDP real growth rate (%) | -4.2 | 8.2 | 2.5 | 1.6 | 2.4 | 2.5 |
| GDP in mil. EUR | 47,045 | 52,279 | 57,038 | 63,090 | 66,833 | 70,936 |
| GDP per capita, in EUR | 22,373 | 24,803 | 27,040 | 29,753 | 31,360 | 33,175 |
| External balance of goods and services as a % of GDP | 9.0 | 5.9 | 2.3 | 6.7 | 4.9 | 4.2 |
| Rate of unemployment by ILO in % | 5.0 | 4.7 | 4.0 | 3.8 | 3.8 | 3.8 |
| Gross wage per employee; real growth rate | 5.9 | 4.1 | -5.6 | 2.1 | 4.1 | 2.2 |
| Labour productivity (% of GDP per employee) | -3.6 | 6.8 | -0.4 | 0.4 | 1.7 | 1.8 |
| Gross fixed capital formation as a % of GDP | 18.9 | 20.2 | 21.6 | 22.5 | 23.0 | 23.2 |
| Average exchange rate USD/EUR | 1.141 | 1.184 | 1.054 | 1.082 | 1.088 | 1.088 |
| Inflation (year average) | -0.1 | 1.9 | 8.8 | 7.4 | 2.7 | 3.4 |
Services provide most of the total value added, but what sets Slovenia apart is the large share of industry: with more than 28% share of the total value added, it is the third most industrialised EU member state. Industry also accounts for 80% of private investment in R&D.
| Agriculture | Industry | Services | |
|---|---|---|---|
| Value added (in % of GDP) | 1.7 | 28.5 | 57.7 |
| Value added (annual % change) | -9.9 | 9.4 | 7.1 |
| Employment by sector (in % of total employment) - data for 2019 | 4.3 | 34.1 | 61.6 |
The agricultural sector: Farmed agricultural area constitutes 30.6% of Slovenia’s total area, with 4.8% of farming dedicated to organic production, with another 5.4% in the system of control of organic production. Forestry also represents a significant part of the economy: 58% of Slovenis’s land is forested, annually contributing EUR 250 million to the economy in production value.
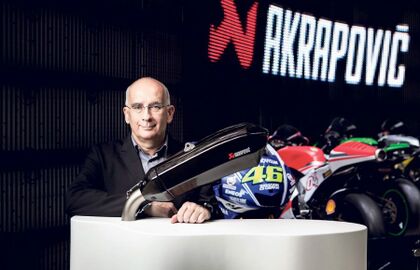
The industrial sector: Since the 1980s, the mechanical industries (automobile, tool machines) and the high value-added industries (electronics, pharmaceuticals, and chemicals) have gone through a significant development, remaining one of the major contributors to the economy and attracting many foreign companies such as Renault, Bosch, Novartis amongst others.
The services sector remains the key part of the Slovenian economy, showing a strong growth pattern over the last ten years, especially in the information and communications technologies (ICT), financial and commercial services, and retail businesses. The tourism sector has also been very dynamic, experiencing a period of accelerated growth prior to the Covid 19 pandemic (6.2 million tourists in 2019, up 5% YOY).
Slovenia’s focus is on exports, representing a large chunk of its economy. In 2023, Slovenian exports of goods amounted to EUR 41.2 billion while export of services reached EUR 11.8 billion – a combined total of EUR 53 billion that is approximately 91 % of the country’s GDP.
| MARKET | Goods in € million | Services in € million | Total in € million |
|---|---|---|---|
| EU-27 | 30,868 | 8,951 | 39,819 |
| Germany | 7,332 | 1,764 | 9,096 |
| Italy | 4,710 | 1,039 | 5,749 |
| Croatia | 4,366 | 838 | 5,204 |
| Austria | 3,102 | 1,501 | 4,603 |
| France | 1,818 | 434 | 2,252 |
| Hungary | 1,383 | 345 | 1,728 |
| Poland | 1,325 | 192 | 1,517 |
| SOUTH-EASTERN EUROPE | 2,888 | 521 | 3,409 |
| Serbia | 1,288 | 299 | 1,587 |
| Bosnia & Herzegovina | 911 | 94 | 1,005 |
| Northern Macedonia | 275 | 44 | 319 |
| OTHER COUNTRIES | 7,561 | 2,378 | 9,939 |
| Russian Federation | 1,117 | 33 | 1,150 |
| USA | 819 | 366 | 1,185 |
| Switzerland | 1,028 | 799 | 1,827 |
| United Kingdom | 808 | 306 | 1,114 |
| TOTAL | 41,317 | 11,850 | 53,167 |
Slovenia encourages foreign investment and does not discriminate between Slovenian and foreign investors.
Keen to attract new investment, the Slovenian government has introduced a number of incentives to support investors. Foreign companies making direct investments and meet certain criteria may be eligible for financial assistance in the form of grants. For more information on financial in scroll down or just contact us.
Foreign investors can invest in most types of business undertakings. Repatriation of profit and capital is unlimited providing due taxes have been settled with the Slovenian Tax Administration.
Slovenia is one of the least restrictive countries among OECD members, along with Portugal, Czechia and Luxembourg (OECD, FDI Regulatory Restrictiveness Index Database 2022).